We have here a collection of statistics for the travel and tourism industry. These collected pieces of information are essential for the industry managers in making business decisions. Statistics provide managers the data needed to know what the consumers want, allowing them to come up with a better strategy on selling products or services that the consumers are likely to buy or avail.
Scroll down for video
Significant Travel and Tourism Statistics
Online Booking Practice by the Numbers

Medium
- Nearly 40% of all the tour and activity transactions are done online (source: Rezdy)
- Around 5.1% of organized tours and 39.7% of the entertainment activities were booked before the trip over the Internet. The latter has almost doubled compared to previous year. (source: Tourism Australia)
- Among Asian tourists, 59% book their travels at anywhere they feel convenient (source: Tnooz)
- In the case of leisure travelers, 60% of them and 41% of business travelers manage their own travel accommodation mostly through the Internet. (source: Amadeus)
- About 148.3 million people make their reservations for their travels, tours, entertainment and even hotel accommodations each year. That’s equivalent to 57% of all travel reservation made in a year. (source: Static Brain)
- The revenue growth that travel companies have gained in the last 5 years is 73% (source:Statistic Brain)
- More and more people prefer doing their business on the Internet—97% of travelers complete their transactions online (source: Forbes)
- Records have it that 20% of Google queries are about local information (source: HubSpot)
- Around 96.8 million adult online users are predicted to use discount code or online coupons. The figure is an indication of a new trend forming—the coupon hunters. (source: eMarketer)
- More than 50% of travelers prefer to do their travel bookings through online than over the phone (source: Hotel Executive)
- 65% of tourists choose to book their accommodations on mobile devices within the day (source: Statistic Brain, 2015)
- According to surveys, over half of the travelers arrange their travel bookings via mobile sites and travel apps (source: Whatech, 2014)
- Tourists are more willing to splurge on tours than on souvenirs or shopping. Here are the top 5 things tourist are most likely to spend money on when traveling: 24% on shopping, 35% on activities, 41% on accommodations, 41% on special dining experiences, and 53% on sightseeing tours. (source: Trip Barometer, 2015)
- 49% of Canadian travelers familiarize themselves on general travel sites such as Expedia, Travelocity, and Orbitz (source: Desination Canada, 2014)
Tour Agencies Web Sites
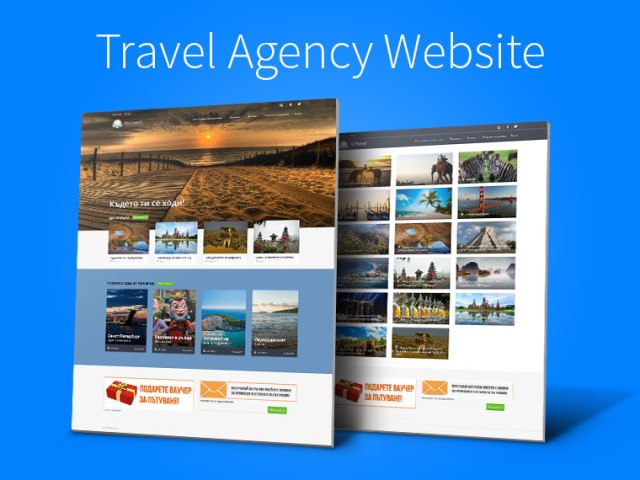
MekongWeb
- In Australia, 20% of travel companies don’t have Web sites (source: amadeus)
- Nearly 90% of tour agencies are still doing manual process when booking trips through e-mail (source: Tourism Research Australia)
- More than half of the survey respondents give people access to the check the price and availability of their products or services (source: Tourism Research Australia)
- 46% of travel agencies with Web sites offer instantaneous confirmation of reservation (source: Tourism Research Australia)
- Those travel companies with Web site admitted that 48% of their traffic referrals are from search engines (source:Tourism Research Australia)
- 93% of Australian tours, 89% Attractions, and 86% Hire and Transport companies have their own online sites (source: Tourism Research Australia)
- About 32% of tourists are likely to ask additional information through the company Web site before making a reservation (source: Google)
- About half of the Australian tourism companies offer online booking for their customers (source: Amadeus)
- Travel companies Web sites are more effective in earning bookings than review websites. (Source: Rezdy)
Smartphones
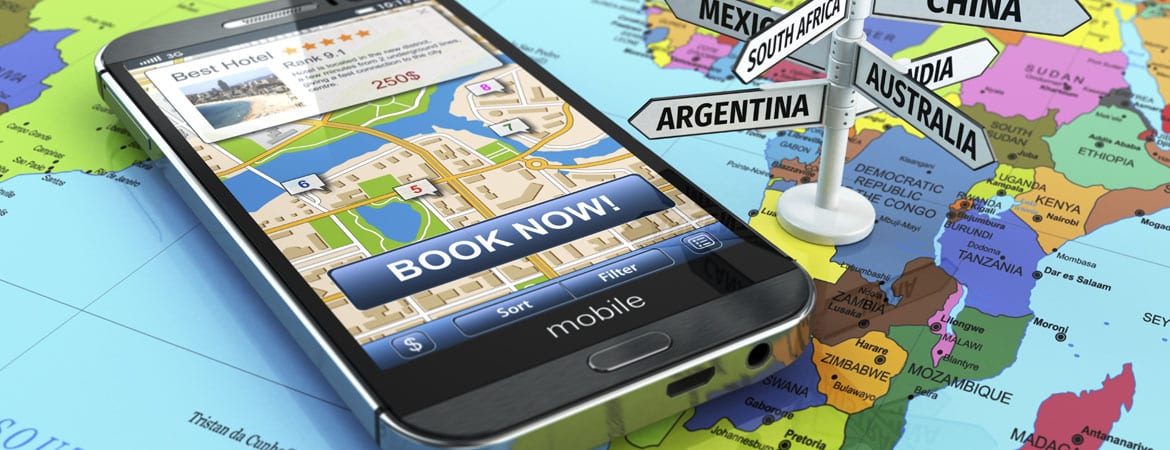
WebInTravel
- 30% of all online bookings are done on mobile units such as smartphones and tablets, and the rate continues to grow 1% per quarter (source: Rezdy)
- Cell phones are the number one commonly used item when on a vacation (source: ETB News)
- 38% of tourists and 57% of business travelers utilize mobile phones for travel information (source: Google)
- 66% is the year to year increase rate of travel-related mobile queries in 2013 (source: Mobile Path to Purchase)
- 31% of mobile phone users say they use their mobile phones in researching travel information (source: Mobile Path to Purchase)
- 14% of mobile phone users finalize their travel bookings in their mobile phones (source: Mobile Path to Purchase)
- 49% of mobile phone users get the travel products prices on Web site aggregators (source: Mobile Path to Purchase)
- An average of 3.3 Web sites are visited and 5.5 research sessions are made by those travelers who use mobile devices when making a reservation (source: Mobile Path to Purchase)
- The use of tablet in making travel arrangements is growing, 9% for tourists and 21% for business (source: Amadeus)
- 20% of Australian family own at least 1 tablet (source: Amadeus)
- 43.8% of travelers are still likely to make last-minute changes on their bookings on their mobile and 5.3% on a tablet (source: Eye for Travel)
- 94% of TripAdvisor consumers use mobile phones when researching for local activities (source: Cross Media Live)
- 23% of tourists and 26% of business travelers utilize mobile phone apps to arrange vacation itinerary (source: Google)
- 29% of Internet users browse Web sites through their mobile devices (source: Tourism Research Australia)
- 67% of smartphone users tend to purchase items online from mobile-friendly Web sites and 61% tend to leave a Web site not suited for mobile use (source: Tourism Research Australia)
- 33% of the time, travelers go online in their mobile phones while on a trip to search for activities they can try in the area (source: tourism Research Australia)
- Smartphone sales surpass that of computers. (source: GigaOm)
- More than half (52%) of travelers made their travel bookings via their smartphones or tablet. Of those travelers, 23% used their smartphones and 29% used their tablet. (source: JiWire)
- A 40% increase in online shopping using mobile devices and smartphones was recorded annually
- Tablets are more profitable than desktops (source: Adobe)
- 74% of people are likely to visit a site again if it’s mobile-friendly (source: Search Engine Watch)
- In 2011, 11% of people utilize their mobile device to seek information for their next vacation activities. The number climbed to 19% the following year. (source: VFM Leonardo)
- 36 million U.S. citizens use their mobile devices when looking for a potential vacation destination while 16 million others use the same device for booking their trips (source: VFM Leonardo)
- Over 60% American users expect Web sites on their mobile devices to load completely within 3 seconds (source: Forbes)
- 85% of American travelers and 87% internationally utilize their mobile devices while on a trip (source: Trip Barometer)
- When on a vacation, 24% of travelers read reviews on their smartphones while 22% use tablets (source: Trip Barometer)
- When on a vacation, 27% of travelers use their mobile phones for their past times while 22% use tablets (source: Trip Barometer)
- 66% of Americans and English users do product research on their tablets before buying (source: Econsultancy)
- 73% of UK and US tablet owners use their device most of the time at home even while they are watching TV or while lying in bed at night (source: Econsultancy)
- 29% of Americans and 31% English want to access websites on their tablets that are specially designed for their tablets. (source: Econsultancy)
- Mobile growth will exceed both the total and online increase to explain the over 25% of total vs online travel reservations. (source: Business Insider)
- Among the challenges that needs to be overcome are lousy UX design, conflicts that prevent users from completing transactions, and lack of Wi-Fi & 4G coverage. (source: Business Insider)
- Mobile apps catch up PC in terms of Internet usage. Mobile internet usage now reached 55% in the US, while PC usage is at 45%. (source: comScore)
- 57% of consumers use their smartphones while 66% use their PC or tablet when looking for a product to purchase. (source: Google)
- 53% of consumers use their smartphones while 83% use their PC or tablet when researching about the product they have bought. (source: Google)
- 43% of consumers user their smartphones while 64% use their PC or tablet when buying a product or service online. (source: Google)
- There was a 40% increase in the number of Americans who made travel reservations online on their tablets in 2014 compared in 2013
- 20% of tablet users are more likely to confirm bookings than those who use smartphones (source: Phocuswright)
- Travel booking sales through mobile devices are expected to climb from $6.15B in 2012 to $39.5B in 2015 in the US (source: Phocuswright)
- Smartphone users are expected to reach $1.75 billion globally in 2014 (source: Eye for Travel)
- Mobile phone users are predicted to reach $4.55 billion globally in 2014 (source: Eye for Travel)
- From 61.1% in 2013, mobile phone invasion is expected to rise to 69.4% in 2017 (source: Eye for Travel)
- 3 hours per day is the average time US consumers spend on their mobile devices in 2014 (source: Eye for Travel)
- 37% of Facebook users access the site on their desktop, while 68% users access it through their mobile devices (source: Eye for Travel)
- 37% of travel bookings in Australia are made on mobile devices (source: Criteo, 2015)
- 45% of travelers utilize their smartphones when booking online their travel activities before the trip (source: Trip Barometer, 2015)
Reviews
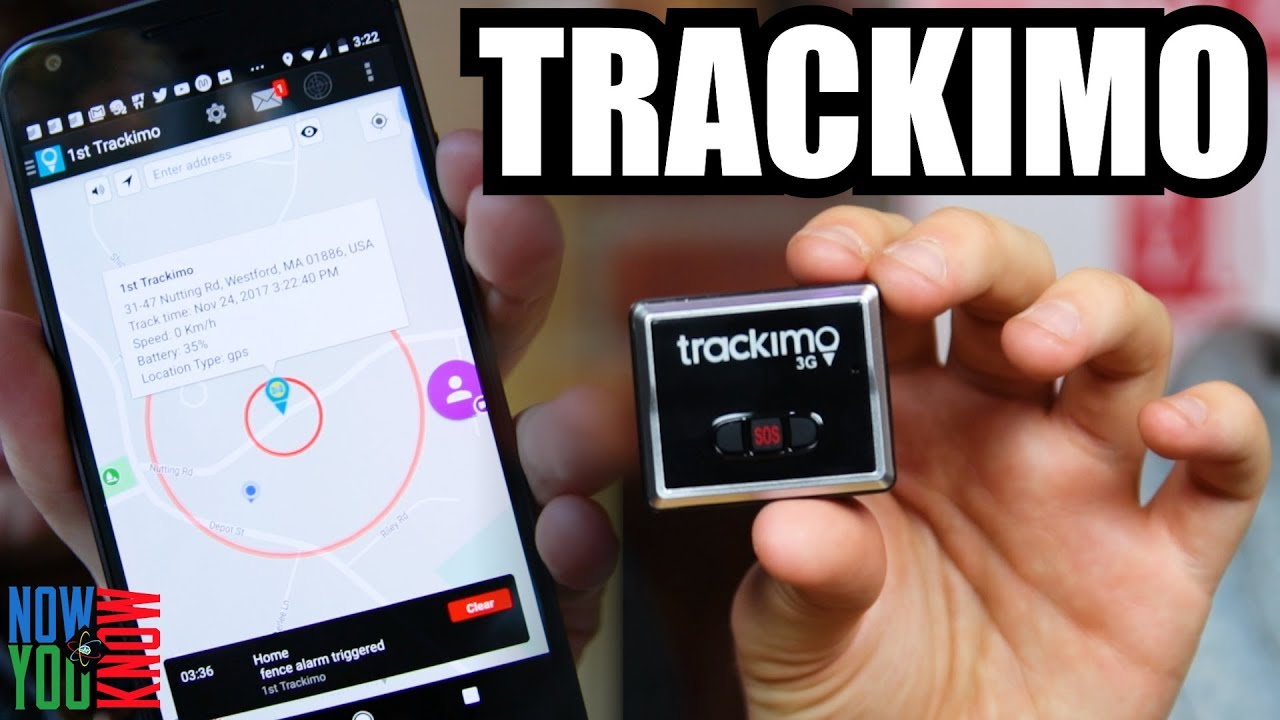
YouTube
- 95% of traveler read reviews online prior to booking (source: Tnooz)
- 6 to 7 is the average reviews tourists read before deciding to make a reservation; while for business travelers, the average is 5 reviews (source: Tnooz)
- Tourists devote an average of 30 minutes on reading reviews prior to booking. For most travelers, only 10% of them spend more than an hour in reading reviews. (source: Tnooz)
- 70% of travelers search for up to 20 reviews during the planning stage of their trip (source: Tnooz)
- It takes not less than 10 reviews for 85% customers before they trust a business or product (source: Search Engine Land, 2014)
- Consumers are likely to use OTA apps and travel aggregator sites like TripAdvisor, search engines like Google, and deal and discounts sites such as Groupon (source: Phocuswright)
- The materials that likely to influence the travelers’ decisions are travel review Web sites at 69%, online travel agencies at 57%, and tour operator sites at 56% (source: Tourism Research Australia)
- 70% of global consumers consider online customer reviews as the second most reliable type of advertising (source: Edelman)
- TripAdvisor site is visited by 260 million distinct visitors a month and has 125 million consumer travel reviews from around the globe (source: TripAdvisor)
- Every sixty seconds, TripAdvisor receives more than 80 user contributions (source: TripAdvisor)
- 93% of travelers admitted that their travel decisions were affected by online reviews (source: Trip Barometer)
- TravelAdvisor reviews are mostly positive with 48% are 5 stars, 29% are 4 stars, and with an average review score of 4.08 (source: TripAdvisor)
- Over 200 million reviews can be found on the Internet (source: TrustYou)
- As of February 2014, TripAdvisor reviews reached 150 million, a 50% increase from the previous year. About 50 million was recorded in 2013—that’s equivalent to 90 reviews every sixty seconds! (source: Tnooz)
- 88% of consumers believe in online reviews the same with personal recommendations (source: Search Engine Land, 2014)
- 39% of consumers regularly read reviews, a 7% increase from 2013 (source: Search Engine Land, 2014)
Watch the video below