
A driver’s license is practically a rite of passage in American culture. However, instead of being a gift for the more privileged 16-year-olds and over, it seems that is has become more of a curse, as it is slowly becoming synonymous with death sentence for thousands of teens each year. This article may help enlighten you about the best and worst states for teen drivers in 2016.
Motor-vehicle accidents remain to be the leading cost of death for teens aged 16 to 29, the same group with the highest risk of getting into car crashes.
Aside from the number of deaths involved, the financial implications are also staggering. Despite making up about 14 percent of the population, 15- to 24-year-olds rack up about a third of all the costs resulting from motor vehicle injuries, and that does not even include costs of auto maintenance, insurance premiums, possible traffic citations, and vehicular incidents.
Scroll down for video
JÉSHOOTS
Over summer, teens spend more time driving as school lets out, but it is also the season where many of them find themselves in accidents, and about 220 teens are killed in car accidents in the United States each month. If you’ve been wondering
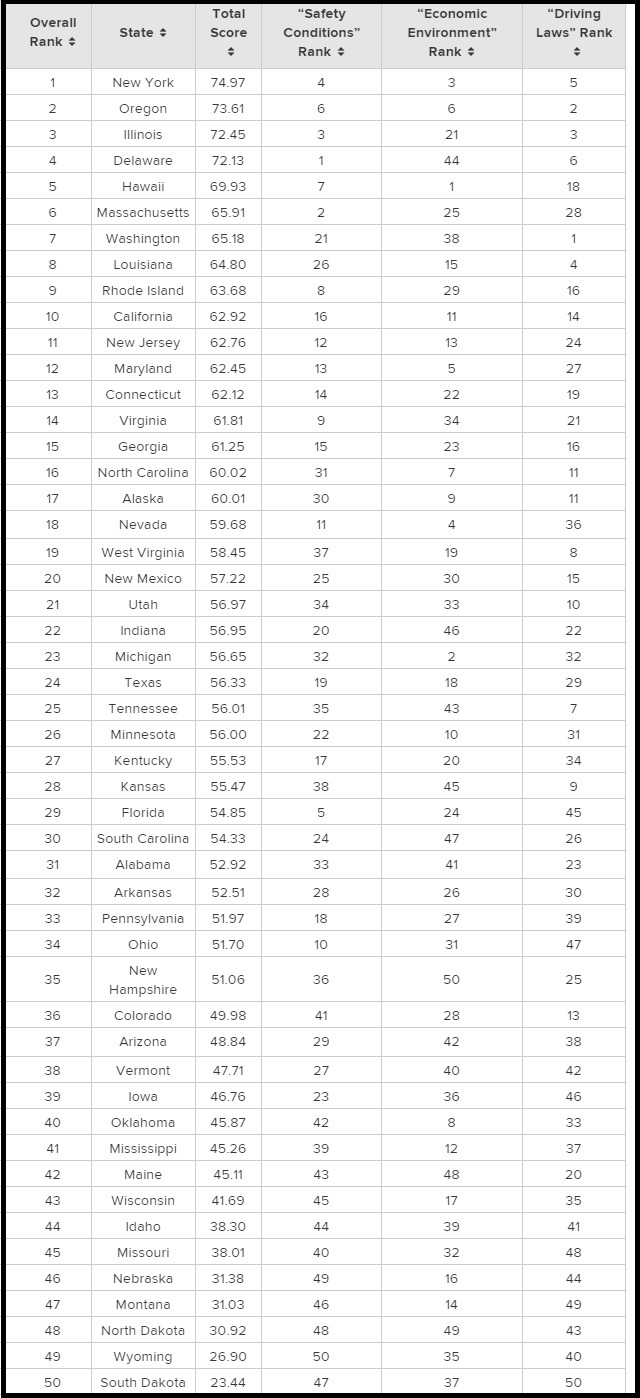
To help ensure teen safety and safeguard their finances, studies have been made to analyze teen-driving environment in different states. The rankings can be found below.
Ranking of States for Teen Drivers
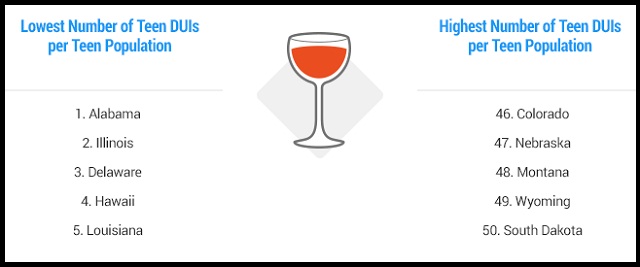
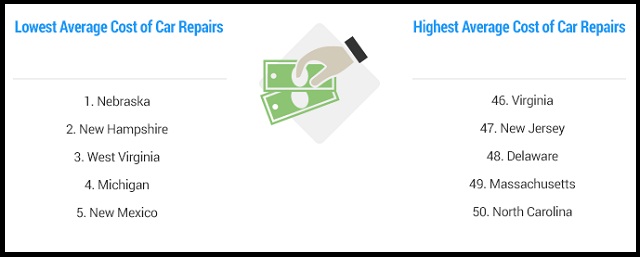
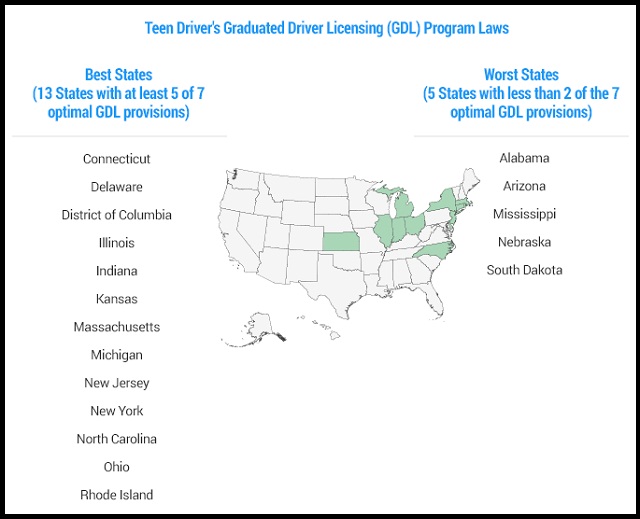
Teens are responsible for their own actions, but their parents still shoulder much of the financial consequences. In areas where teen deaths are prevalent, it’s up to the lawmakers to implement programs and policies that are aimed at reducing the numbers.
Methodology
In identifying the best and worst states for teen drivers, teen-driving environment in the 50 states were analyzed across three dimensions: safety conditions, economic environment, and driving laws.
These categories are comprised of 16 different metrics, and they are scored on a 0-to-100 point scales, with 100 being the most favorable conditions. Here are the results for all the average of all metrics ranked accordingly:
Safety Conditions: 50 points
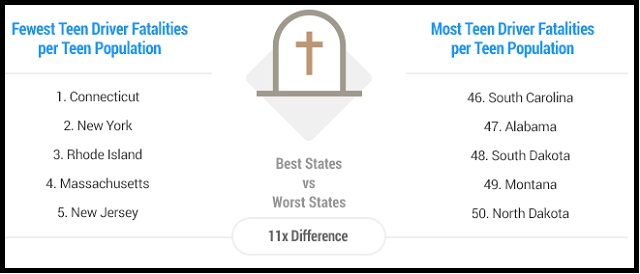
- Number of Teen Driver Fatalities per 100,000 Teens: (Double Weight) ~16.67 Points
- Number of Vehicle Miles Traveled per Capita: (Full Weight) ~8.33 Points
- Number of Teen “Under the Influence” Traffic Violations per 100,000 Teens: (Double Weight) ~16.67 Points
- Quality of Roads: (Full Weight) ~8.33 Points
Economic Environment: 20 points
- Maximum Cost of a Speeding Ticket: (Half Weight) ~1.82 Points
- Maximum Cost of a Red-Light Ticket: (Half Weight) ~1.82 Points
- Maximum Amount of First-Offense Fines for Not Wearing a Seat Belt: (Half Weight) ~1.82 Points
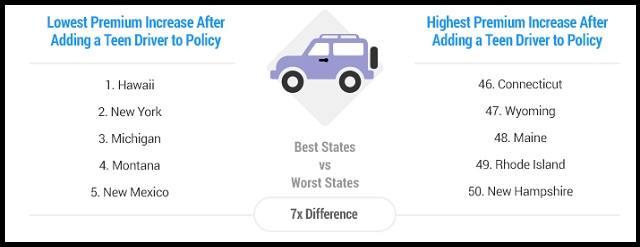
- Premium Increase After Adding a Teen Driver to a Parent’s Auto Insurance Policy: (Double Weight) ~7.27 Points
- Average Cost of Car Repairs: (Full Weight) ~3.64 Points
- WalletHub “States With the Highest and Lowest Insurance Premium Penalties for High Risk Drivers” Ranking: (Full Weight) ~3.64 Points
Driving Laws: 30 points
- Teen Driver’s Graduated Driver Licensing (GDL) Program Laws: (Full Weight) ~6.00 Points
- Presence of Occupant-Protection Laws: (Full Weight) ~6.00 Points
- Presence of Impaired-Driving Laws: (Half Weight) ~3.00 Points
- Presence of Distracted-Driving/Texting-While-Driving Laws: (Full Weight) ~6.00 Points
- Presence of Red-Light and Speeding-Camera Laws: (Half Weight) ~3.00 Points
- “Strictest and Most Lenient States on DUI” Ranking: (Full Weight)~6.00 Points
Watch the video below